
Power BI vs Tableau vs Custom BI Dashboards for Enterprise Reporting
When it’s time to choose an enterprise reporting tool, several factors could impact the final decision. Choosing a tool for the wrong reason usually results in a poor experience for the people who should make decisions based on such reports. Moreover, this ends up affecting the company’s direction and its business. Sometimes, a well-designed demo, a well-known brand, or an existing license frequently carries more weight than how reporting actually functions.
In the upcoming sections, we’re going to compare the three common reporting dashboard development solutions used in larger organizations:
- Power BI app development
- Tableau development services
- Custom BI dashboard development
The intent here is not to rank them or to declare a “winner”. Instead, the purpose of this article is to explain how each option behaves in real enterprise environments once multiple teams are involved, data ownership is shared, and the dashboard starts influencing decisions rather than just illustrating them.
Follow along while we walk through how each approach is typically adopted, where it works well, and where friction arises. Tradeoffs are explicit, and limitations are treated as design constraints rather than failures.
How Does Enterprise Reporting Look?
One important thing that you should always keep in mind about enterprise reporting is that it never starts in a green field. In fact, most organizations face the same issues when trying to implement a reporting system: they already have several data sources created for different purposes, inconsistent naming, granularity, or refresh schedules, and multiple audiences looking at the same numbers for different reasons.
On the other hand, experience shows that a single dashboard often ends up doing too many jobs at once, from monitoring KPIs to explaining anomalies during reviews and acting as a shared reference point in meetings. Over time, it also becomes a proxy for trust in the underlying data.
The issues mentioned above are just some of the most common challenges that a company may face when considering the best approach to implement such a system. As you may notice, visualization alone is rarely the hard part. Charts are visible, but the real complexity lives underneath. Data definitions, refresh timing, access control, and versioning tend to dominate discussions once reporting matters.
Having such context in mind will make it easier for the reader to reason about the differences between Power BI, Tableau, and custom BI dashboards.
Power BI: Reporting in a World Shaped by Microsoft
For companies having access to the Microsoft 365 suite, Microsoft Power BI is often adopted by default rather than by deliberate choice. Actually, this approach is a good fit if you combine it with other tools inside Microsoft’s ecosystem:
- Azure SQL, Synapse, or Data Lake as data sources.
- Azure Active Directory for identity and access.
- Excel is a familiar entry point for report authors.
A commonly followed approach is to create individual reports that are built in Power BI Desktop and then published to shared workspaces. Later, they can be bundled into apps for broader consumption. In addition, you can follow usage growth by centralizing semantic models that can be reused across different reports. If your company feels comfortable with standardized reporting and executive dashboards where metrics are stable and refresh cycles are predictable, then this approach could be a good fit.
One of the big advantages of Power BI is coherence. Authentication, permissions, and sharing all follow the same mental model teams already use for other Microsoft tools. That reduces the operational overhead of “just getting access” right.
In terms of costs, per-user licensing is relatively easy to reason about early on, and Premium capacity only becomes relevant once concurrency and dataset size increase.
If we have to mention some tradeoffs, we could start with flexibility. The semantic layer is powerful, but it requires discipline. DAX expressions accumulate quickly, and without strong ownership, measures can become hard to reason about or safely change. Customization is another boundary. Power BI handles classic reporting well, but once requirements drift toward real-time enterprise dashboards, custom interactions, or nonstandard workflows, teams start pushing against the platform. Embedding is possible, but it adds architectural complexity that isn’t always obvious at the start.
Tableau: the Analytics-First Approach
Tableau is usually brought to companies through analytics teams rather than IT or platform groups. This is mainly because this tool allows analysts to move quickly without waiting for engineering support.
The main focus of Tableau’s development services is exploratory analysis, rich, expressive visualizations, and analyst-driven dashboard creation. Tableau Server or Tableau Cloud is used to publish dashboards, and access can be granted through projects and permissions. When users need to explore data and ask follow-up questions rather than consume fixed reports, that’s where Tableau shines.
Tableau’s visualization engine is one of its strongest points. It makes dense dashboards, layered comparisons, and nuanced visual encodings easy to build and easy to read. Moreover, organizations that value self-service analysis can also benefit from using Tableau, as it significantly reduces dependency on centralized BI teams. Analysts can discuss and iterate directly with stakeholders, performing adjustments to views on demand as the questions evolve.
In Tableau, licensing can expand quickly as viewership rises, especially when dashboards are utilized by multiple analysts. So you definitely have to keep an eye on cost usage. Another area where tradeoffs are evident is in operational reporting. Tableau is excellent for analysis, but less natural for highly standardized enterprise reporting solutions that require strict metric definitions, long-term stability, and minimal variation across consumers.
Building a Reporting Software with Custom BI Dashboards
When companies start implementing a reporting system, using a packaged BI dashboard such as the ones mentioned above is often the way to go. Such tools offer a quick way to aggregate data, apply filters, and surface trends in an easy way. However, at this system scale, users may start requiring some additional features that “tighten” such a dashboard to the company’s operational workflow. Some examples are triggering follow-ups, approvals, or automated actions based on the information contained in the report.
At this point, development teams start facing a challenging decision: whether to invest time trying to apply such configurations to the packaged tools or start building their own solution based on the team’s tech stack. In many cases, teams will lean toward the second option.
Having a reporting system that is a fully operational application, which handles entire workflows like business rules, permissions, and decision paths, often justifies the need for a custom BI dashboard. In this case, the tool is no longer a passive artifact used for data visualization; it becomes a real software solution that solves more problems than just the reporting itself.
By developing a custom BI dashboard, the company retains full control of all the implementation. Here, there is no third-party platform’s abstraction layer to circumvent. Instead, the development team retains complete ownership of the integration points, deployment models, and performance attributes. This often includes things such as the interfaces built around internal workflows, the APIs that expose metrics with explicit contracts, and the data pipelines tailored for particular use cases.
Ownership is also impacted. A custom solution often implies that reporting stops being something “owned by analysts”; now it will “spread” to different teams inside the company, including data, engineering, and business teams. This also implies some changes in terms of organization. Things such as versioning and documentation start to become mandatory, and changes are reviewed with the same rigor as application code. Of course, this will increase the initial effort, but it will pay off later by reducing ambiguity and rework.
Another crucial factor of this approach is engineering. Within a custom BI solution, there’s no drag-and-drop authoring, no built-in semantic layer, and no vendor-managed upgrades. All the features have to be implemented from scratch. Of course, there are several libraries and solutions that developers can use to accelerate the development, particularly in order to render graphs (for example, D3, Chart.js, or ECharts), but they are not the center of gravity. Data modeling, access control, and performance tuning are where the real work lives.
On the other hand, maintenance becomes explicit. Developers will have to provide support and fix reported issues. Moreover, each new metric, visualization, or feature request will consume development time. Teams that underestimate this effort at the beginning will probably suffer later.
Ultimately, a hybrid approach is often recommended: instead of viewing custom BI dashboards as a replacement for Power BI or Tableau, they should be considered a complement. Companies could rely on packaged tools for exploratory analysis and ad-hoc reporting, and implement custom dashboards for more complex workflows that directly support revenue, operations, or compliance.
What Custom BI Dashboard Logic Looks Like in Practice
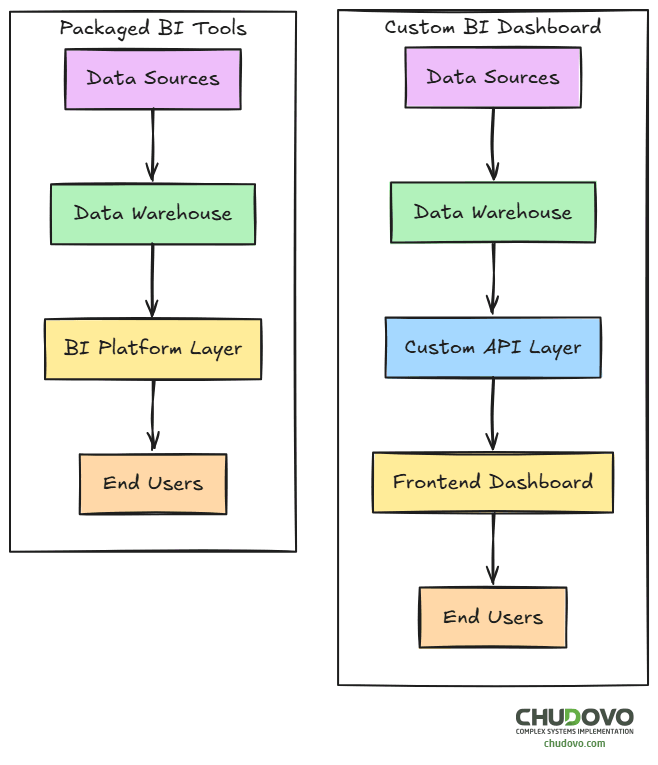
An API that manages the business logic and a frontend side that shows the user interface typically make up a custom BI dashboard.
Here’s a basic example on how to build an API endpoint to return revenue information:
// metrics.controller.ts
import { Request, Response } from "express";
import { revenueService } from "../services/revenue.service";

export async function getRevenueOverview(req: Request, res: Response) {
  try {
    const { startDate, endDate } = req.query;

    const metrics = await revenueService.calculateOverview({
      startDate: String(startDate),
      endDate: String(endDate)
    });

    res.json({
      period: { startDate, endDate },
      metrics
    });

  } catch (error) {
    res.status(500).json({ error: "Failed to retrieve revenue metrics" });
  }
}
You may also add some role-based metric filtering logic to manage permissions depending on the metrics the user is trying to retrieve:
// authorization.middleware.ts
export function enforceMetricAccess(userRole: string, metric: string) {
  const accessMatrix: Record<string, string[]> = {
    executive: ["revenue", "churn", "forecast"],
    finance: ["revenue", "costs", "margin"],
    operations: ["throughput", "cycleTime"]
  };

  return accessMatrix[userRole]?.includes(metric);
}
Finally, you may need a frontend application that fetches the information from the API and displays it to the end user. Here is a simple example done with React:
// RevenueSummary.tsx
import { useEffect, useState } from "react";

export function RevenueSummary() {
  const [data, setData] = useState(null);

  useEffect(() => {
    fetch("/api/metrics/revenue?startDate=2024-01-01&endDate=2024-12-31")
      .then(res => res.json())
      .then(setData);
  }, []);

  if (!data) return <p>Loading...</p>;

  return (
    <div>
      <h2>Total Revenue</h2>
      <p>${data.metrics.totalRevenue}</p>
    </div>
  );
}
While the code does not tend to be production-ready, it illustrates some of the basic components of a custom BI’s architecture.
Side-by-Side Comparison
At a high level, these differences tend to show up consistently across organizations:
| Dimension | Power BI | Tableau | Custom BI Dashboards |
| Initial setup | Fast | Moderate | Slow |
| Analyst self-service | Limited | Strong | None |
| Custom workflows | Limited | Limited | Full |
| Cost profile | Predictable licensing | Scales with users | Engineering headcount |
| Real-time use cases | Constrained | Constrained | Strong |
| Governance model | Strong in the Microsoft stack | Requires discipline | Fully custom |
This table flattens a lot of nuance, but it helps anchor the discussion.
Governance and Ownership
The use of BI dashboards could expose governance problems when there are several people (or teams) involved in the process of creating the report system. The choice of tools mentioned above might also impact the way governance works.
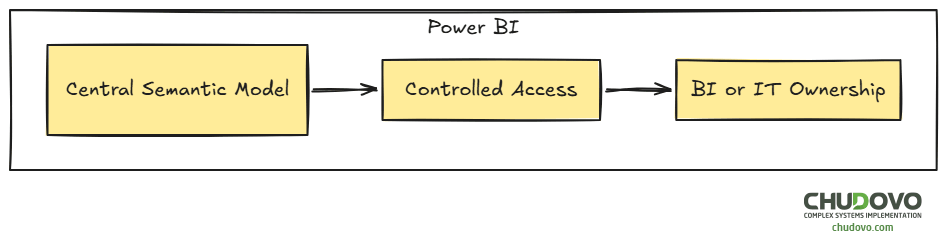
For example, Power BI helps centralize the ownership by using a model-centric approach, which results in a single source of truth. However, having a rigid model could slow down iteration, especially for small changes that may require modifying the whole model.
On the other hand, by choosing Tableau, you are not required to define the logic in a “foundational” model; instead, you can do so “on the fly” when creating the visualizations. While this provides clear agility and independence for analysts, it can lead to metric drift, for example, if two analysts calculate the same value by using different formulas.

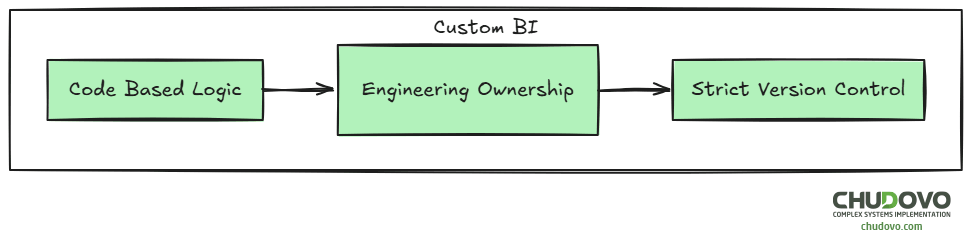
Finally, we already mentioned that a custom BI dashboard spreads the ownership across different parts of the organization. Among others, development teams have a direct responsibility for the dashboard’s proper way of working. If something has to be changed or fixed, you need the development team to get involved. This could be either a strength or a bottleneck in some situations.
In the end, none of the existing tools will remove the need for a clear ownership policy. But the way you tackle this topic will definitely depend on the tool you choose.
Costs
Packaged BI solutions imply licensing costs. Custom BI dashboards carry on operational costs (mainly because of engineering). While the first one is “easy” to compare among different tools, operational costs are often underestimated. On the other hand, relying on third-party solutions may introduce long-term platform dependency. Over time, costs show up either as vendor renewals or internal headcount. When choosing a solution, you have to think about which one of the above your company feels more comfortable with.
Closing Perspective
As we’ve seen through the previous sections, the real question is not whether to choose between Power BI or Tableau, nor between a packaged BI dashboard versus a custom solution. All of them have their own pros and cons, and serve different purposes. What you really have to think about is the way reporting fits into your organization’s work. Having that clear, the final decision will narrow on its own.
For early-stage reporting, usually Power BI or Tableau are the best options, because they allow teams to move quickly and find what actually matters. As reporting becomes embedded in daily operations, custom solutions start to make more sense.
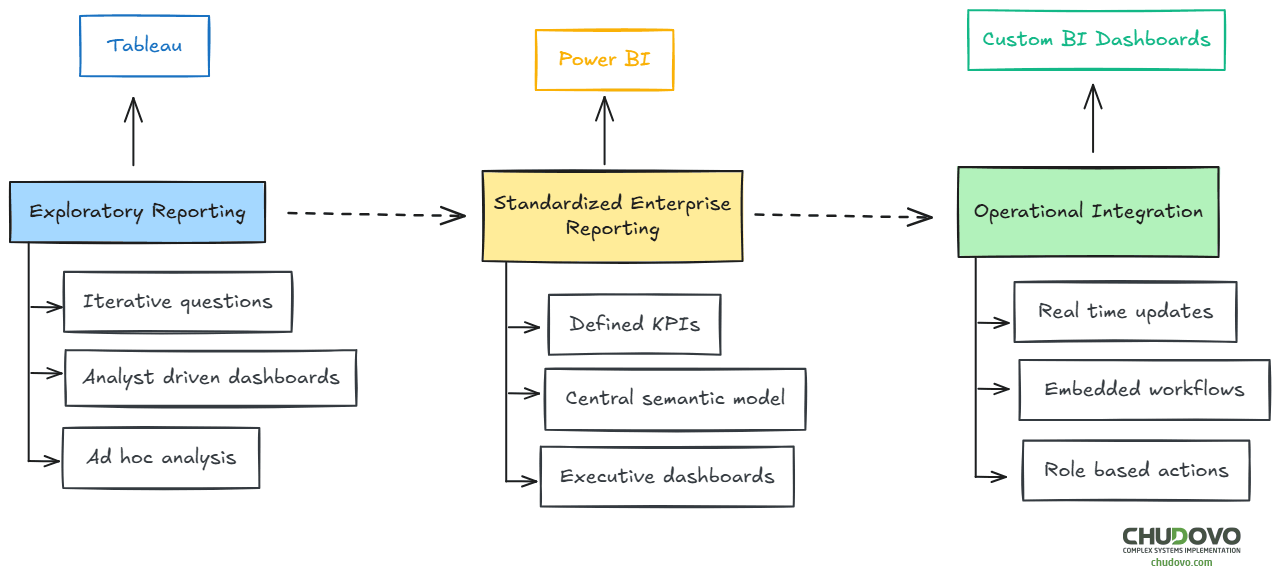
The truth is that most large organizations do not pick a unique option. Power BI, Tableau, and custom BI dashboards often coexist and serve different purposes within the reporting stack. Power BI may handle executive summaries and standardized KPIs. Tableau may remain the tool of choice for analysts exploring new questions. Custom dashboards may power operational views embedded directly into internal systems.
For enterprise teams evaluating reporting and dashboard development services, this perspective can prevent costly rework. Tool selection should follow reporting maturity, not precede it. When reporting is treated as infrastructure rather than decoration, the technical choices tend to align more naturally with business needs.
